
Bimodal Aggregate Attestations

Question
Why do aggregate attestation propagation times on Ethereum mainnet show a bimodal distribution with a second peak 6-8 seconds after the first?
Background
Aggregate attestations are published by selected aggregators at 2/3 of each 12-second slot (~8s mark) on the beacon_aggregate_and_proof gossipsub topic. Under normal conditions, they should arrive as a single cluster around the 8s mark.
Instead, we observe two distinct peaks: a main peak at ~8s and a second peak at ~14-16s. The second peak comprises roughly 28% of all observed messages and is remarkably consistent across time windows (10 minutes to 24 hours).
This investigation traces the source of the second peak through gossipsub peer data and cross-references it with consensus client source code.
Investigation
When Observing Propagation
The histogram below shows aggregate attestation arrival times in 250ms bins.
View Query: bimodal_agg_att_histogram
The bimodal shape is unmistakable. The main peak centers around 8-9s (normal gossip propagation), while a second peak forms around 14-16s - consistently about 12 seconds offset from slot start, aligning with the next slot boundary.
When Confirming Rebroadcasts
To determine whether tail messages are novel aggregates arriving late or rebroadcasts of already-seen messages, we classified each observation by its gossipsub message_id. An observation is "rebroadcast" if the same message_id was first seen in an earlier 1-second bin - meaning the message had already propagated through the network before being re-published.
View Query: bimodal_agg_att_rebroadcast_gap
The second peak (14-16s) is almost entirely red - these are rebroadcasts of messages that already arrived during the main peak at 8-9s. Overall, 95.2% of tail observations share a message_id with an earlier peak observation. Only 1.6% of unique message_id values appear exclusively in the tail.
When Identifying the Source
By joining peer IDs with heartbeat data, we can identify which client each message was forwarded by. The chart below shows what percentage of each client's forwarded messages fall in the tail.
View Query: bimodal_agg_att_client_breakdown
Prysm accounts for ~51% tail - nearly half of all messages it relays arrive late. In contrast, Teku shows < 1% tail and Lighthouse ~1%. This points to a Prysm-specific mechanism. Note that Erigon also shows an elevated tail (~19%), though we observe far fewer Erigon peers than Prysm peers so the comparison should be interpreted with caution.
When Examining Per-Peer Variance
The per-client averages above mask enormous variance across individual peers. The chart below shows the distribution of tail rates for individual peers, grouped by client. Each peer's tail rate is the percentage of their forwarded aggregates that land in the tail window.
View Query: bimodal_agg_att_per_peer
Lighthouse and Teku peers cluster tightly near 0% (median 0.0%, P95 under 4%). Prysm peers are spread across the entire range (median 30%, IQR 10-54%) - some peers show almost no tail while others push above 80%. This suggests the rebroadcast behavior depends heavily on individual node state, likely how quickly each node processes blocks relative to when aggregates arrive.
When Tracing the Trigger
After staring at the histogram long enough, the second peak at 14-16s starts to look suspiciously like the shape of block arrivals for the next slot (~12s from slot start). If that's not pareidolia, it would suggest a mechanism where block N+1's arrival triggers the delayed processing. One possibility: if a node is missing block N when aggregates arrive at 8s, it may not fetch block N until block N+1 arrives and reveals the missing parent - at which point the node requests block N via req/resp and processes the queued aggregates. To test this, for each slot N we plot the aggregate tail P50 against the block arrival time at slot N+1.
View Query: bimodal_agg_att_block_correlation
The correlation is strong (r = 0.91). Tail timing for slot N's aggregates tracks closely with when slot N+1's block arrives on the network, consistent with a mechanism triggered by block processing.
When Catching Peers Behind
The libp2p_handle_status table records periodic status exchanges with each peer (~every 4 seconds), including their reported head_slot. For each Prysm peer, we checked outbound status exchanges during seconds 5-8 of each slot - right around the aggregation deadline. If a peer's response_head_slot was less than our request_head_slot, we classified them as "caught behind" for that slot. We then checked what aggregate attestations that peer forwarded to us for that same slot.
View Query: bimodal_agg_att_lag_correlation
Peers caught behind are almost completely silent: 96.5% sent us nothing at all, compared to 58.5% for peers that had the block. Prysm nodes that haven't processed the referenced block suppress gossip forwarding entirely - they don't forward the aggregate to any of their mesh peers.
At first glance, the low tail rate from behind peers (0.7%) might seem to contradict the idea that slow block processing causes the tail. If these peers are the source of the problem, why aren't they the ones sending us tail messages? Is there a race condition at play - and if so, how does the re-broadcast actually propagate through the network?
When Profiling Slow Nodes
What does "behind" actually mean? To find out, we classified Prysm peers by how often they were caught behind during the 15-minute sample.
The distribution is sharply bimodal: a peer is either keeping up or stuck. There's almost no middle ground. Looking at how far behind the stuck peers are reveals two distinct populations:
- ~750 observations, 1-3 slots behind: Peers that received the block but haven't finished processing it yet. 95.9% recover within 36 seconds. These are the "slow processors" that drive the rebroadcast tail.
- ~51 peers, hundreds to thousands of slots behind: Stalled syncs or abandoned nodes. Median deficit of ~84,848 slots (~12 days). These are broken, not slow.
Block delivery itself is healthy: p50 = 1.9s, p99.9 = 3.8s, with 99.94% of blocks arriving within 4s. The problem is block processing latency, not missing blocks.
Prysm version also matters. Older versions show significantly higher behind rates - v7.0.0 has nearly 3x the rate of v7.1.2 (latest stable), suggesting many are unmaintained deployments.
Analysis
Prysm: Possible Pending Queue Re-broadcast
Prysm's source code contains a mechanism that may explain the tail. When a Prysm node receives an aggregate but hasn't processed the referenced block yet, it saves the aggregate to a pending queue and returns ValidationIgnore (suppressing gossip forwarding). From validate_aggregate_proof.go:
func (s *Service) validateBlockInAttestation(ctx context.Context, satt ethpb.SignedAggregateAttAndProof) bool {
    blockRoot := bytesutil.ToBytes32(satt.AggregateAttestationAndProof().AggregateVal().GetData().BeaconBlockRoot)
    if !s.hasBlockAndState(ctx, blockRoot) {
        s.savePendingAggregate(satt)
        return false
    }
    return true
}
When the missing block eventually arrives, processPendingAttsForBlock() flushes the queue. This is called immediately after block import in beaconBlockSubscriber. Notably, the pending blocks queue also performs parent-chain sync: when block N+1 arrives but parent N is missing, Prysm sends a BeaconBlocksByRoot req/resp request to fetch block N. This may explain the strong r=0.91 correlation with block N+1's arrival - the next block's arrival triggers the fetch of the missing parent, which then flushes the pending attestations.
For each pending aggregate, processAggregate() re-publishes it via gossipsub:
func (s *Service) processAggregate(ctx context.Context, aggregate ethpb.SignedAggregateAttAndProof) error {
    res, err := s.validateAggregatedAtt(ctx, aggregate)
    if err != nil {
        return errors.Wrap(err, "validate aggregated att")
    }
    if res != pubsub.ValidationAccept || !s.validateBlockInAttestation(ctx, aggregate) {
        return errors.New("Pending aggregated attestation failed validation")
    }
    att := aggregate.AggregateAttestationAndProof().AggregateVal()
    if err := s.saveAttestation(att); err != nil {
        return errors.Wrap(err, "save attestation")
    }
    _ = s.setAggregatorIndexEpochSeen(att.GetData().Target.Epoch,
        aggregate.AggregateAttestationAndProof().GetAggregatorIndex())

    if err := s.cfg.p2p.Broadcast(ctx, aggregate); err != nil {
        log.WithError(err).Debug("Could not broadcast aggregated attestation")
    }
    return nil
}
Note that validateAggregatedAtt performs cryptographic and consensus validation (signatures, committee membership, FFG consistency) but does not check block presence - that's solely the job of validateBlockInAttestation. So if the block is now available (which it should be, since the queue was flushed by block arrival), both checks pass and Broadcast() fires.
This Broadcast() call is a full gossipsub re-publish. If this code path is responsible for the tail, the propagation may work as follows: because the original aggregate was handled with ValidationIgnore, it would not be added to the gossipsub seen cache on the behind node. So the re-broadcast could propagate through other behind Prysm nodes that also returned ValidationIgnore and lack the message_id in their seen cache - while peers that already accepted the original would correctly deduplicate and ignore it.
Per-peer variance is massive (IQR 10-54% across individual Prysm nodes), suggesting node-specific state (block processing latency, mesh topology) strongly modulates the effect. If this is the mechanism, it would function as a race condition:
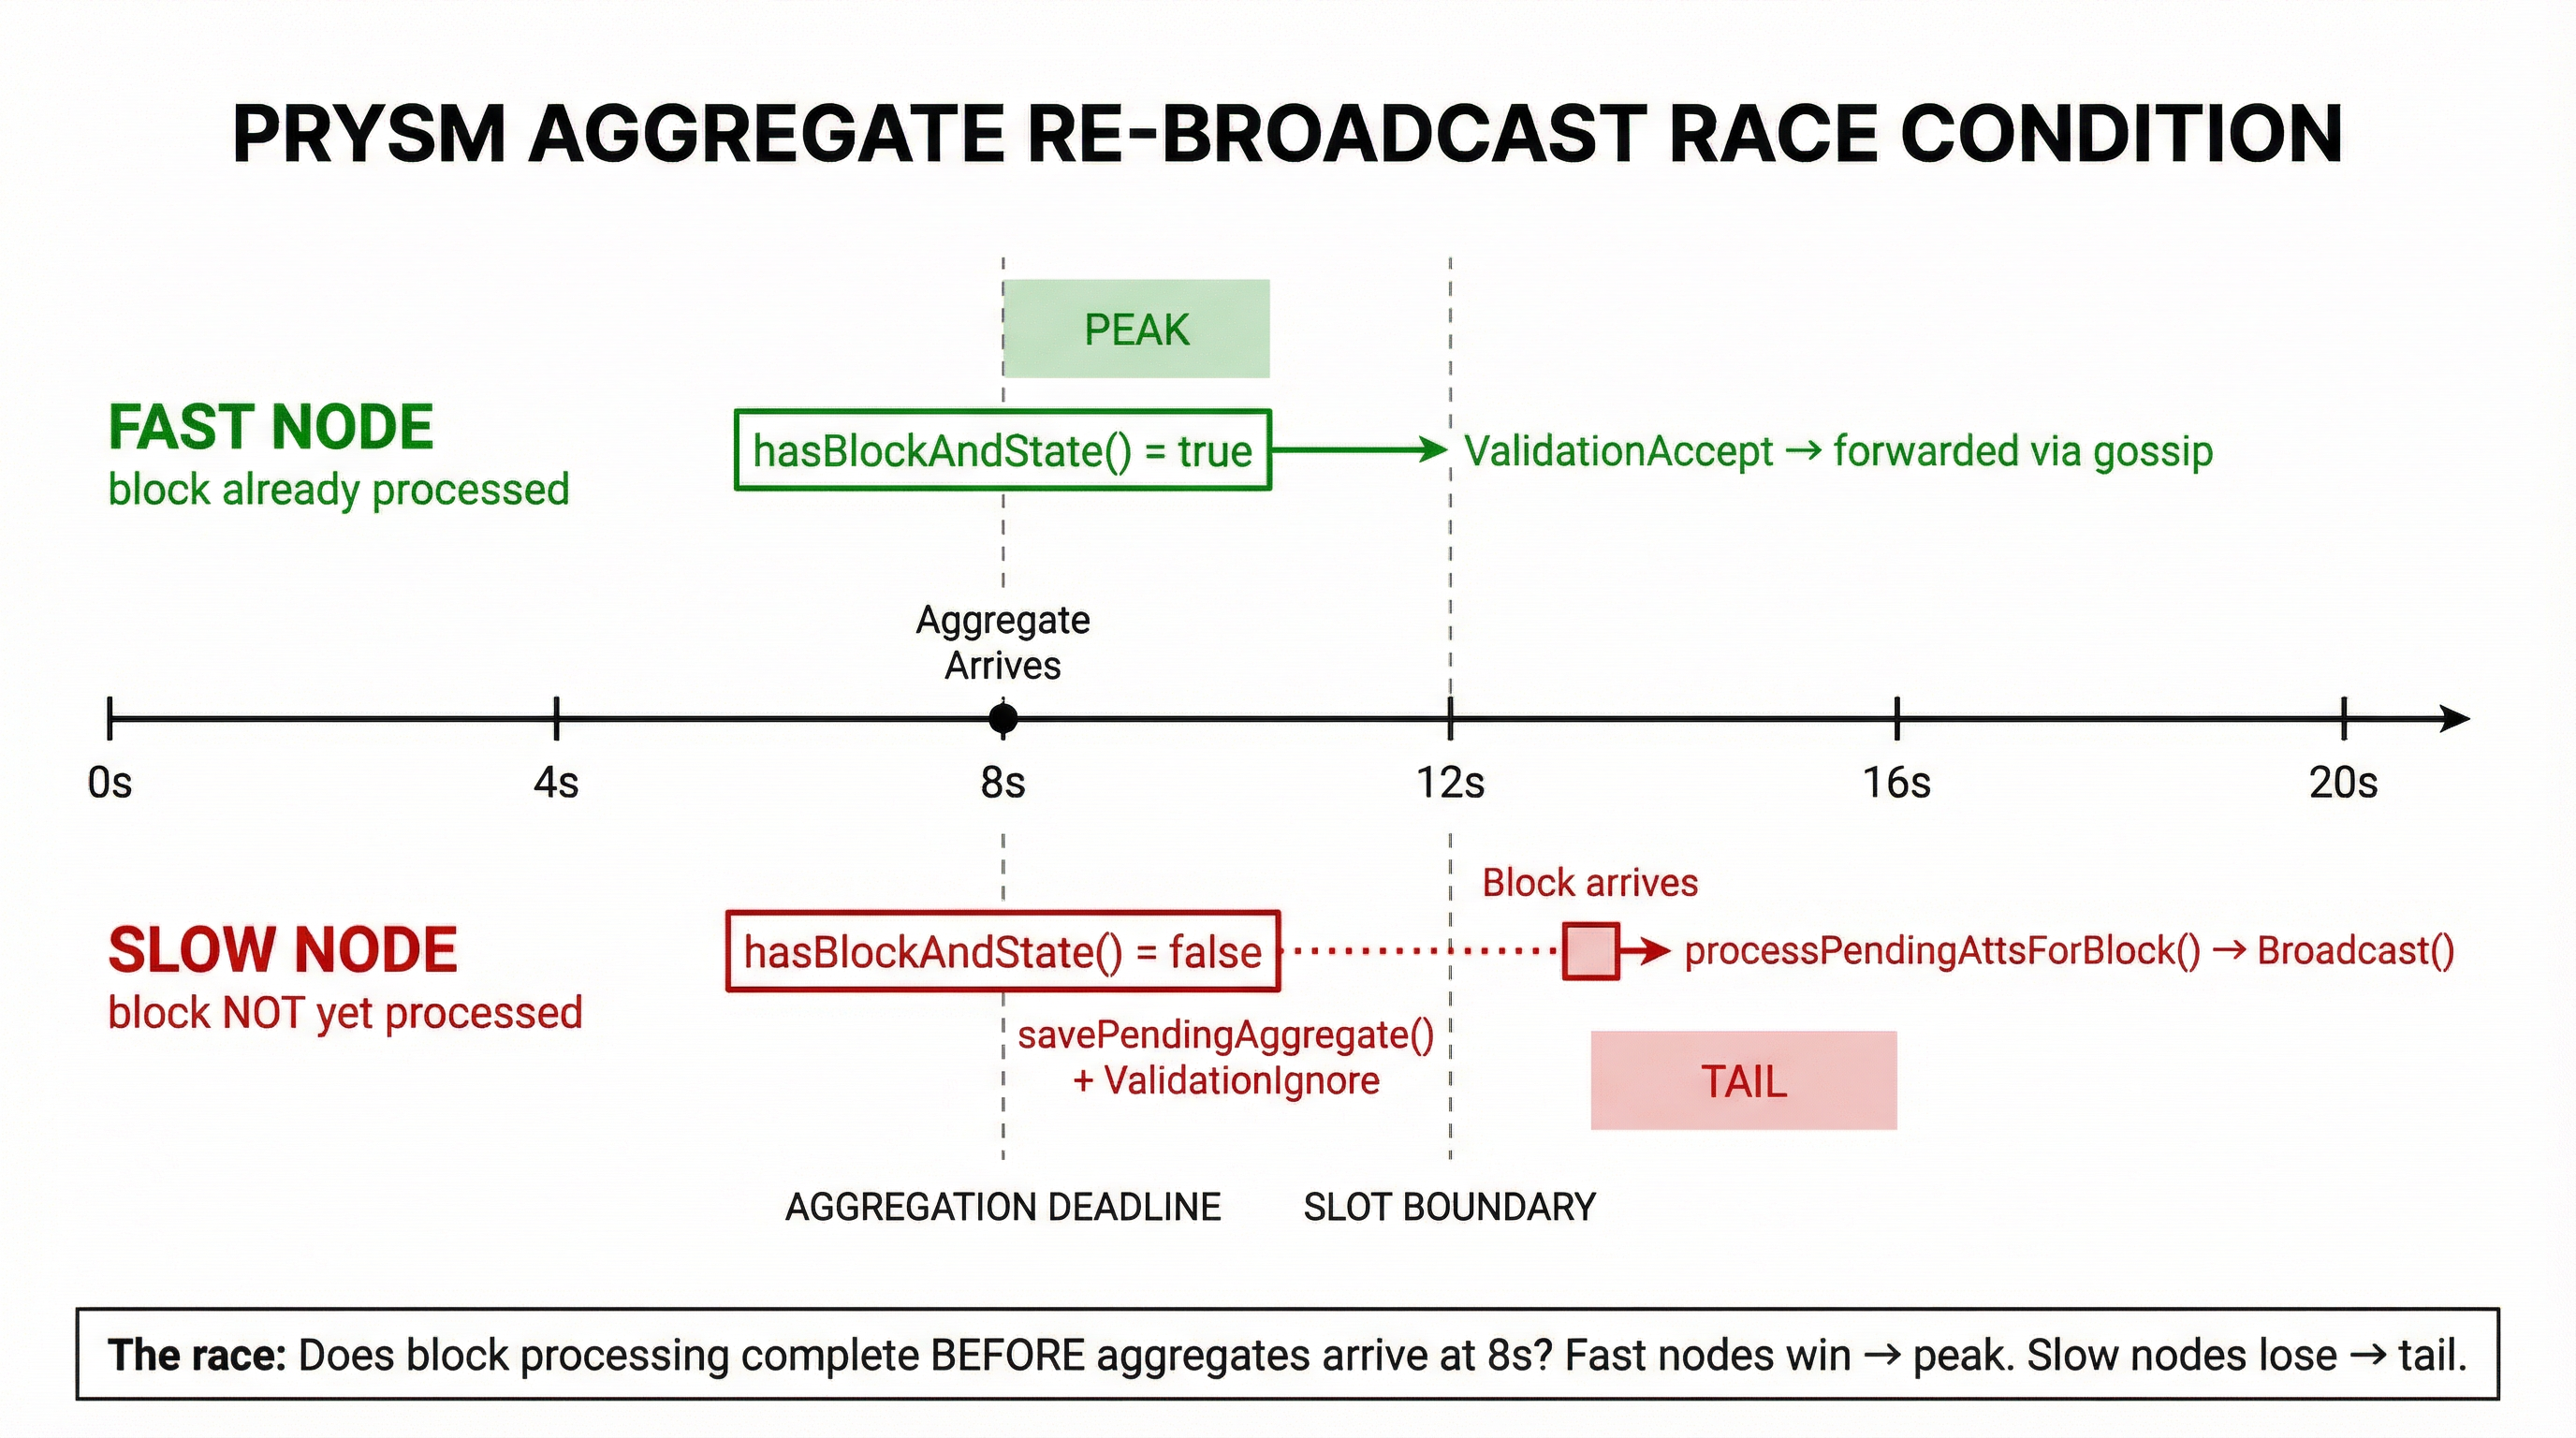
Fast nodes that have already processed the referenced block return ValidationAccept immediately - the aggregate is forwarded during the main peak at 8-9s. Slow nodes that haven't processed the block yet queue the aggregate and return ValidationIgnore. When the block finally arrives, the pending queue is flushed and Broadcast() re-publishes the aggregate - producing the second peak at 14-16s.
Lighthouse and Teku: No Re-broadcast
Lighthouse and Teku both queue aggregates for unknown blocks, but handle them differently when the block arrives - and this may be why they show almost no tail (< 1% and ~1% respectively).
Lighthouse queues the attestation in a reprocessing queue with a 12-second timeout. When the block arrives, it re-validates the aggregate and calls propagate_validation_result(Accept) on the original gossipsub message - telling libp2p to accept the message it already received, not publishing a new one. It also sets allow_reprocess: false on the re-queued item to prevent infinite reprocessing loops.
Teku returns SAVE_FOR_FUTURE and stores the aggregate in a PendingPool indexed by the required block root. When onBlockImported() fires, it retrieves only the attestations waiting on that specific block and re-validates them through the normal path - again, no new Broadcast().
The critical difference: both clients re-validate the original gossipsub message rather than creating a new publish. Prysm's Broadcast() call generates a fresh gossipsub message with a new publish, which is what other nodes see as a "rebroadcast".
Erigon: Proposer-Only Forwarding
Since the Fulu fork (activated Dec 3, 2025), Erigon's Caplin consensus layer only processes aggregates on nodes with upcoming proposer duties. In aggregate_and_proof_service.go, the isLocalValidatorProposer check gates all aggregate processing:
func (a *aggregateAndProofServiceImpl) isLocalValidatorProposer(
    headState *state.CachingBeaconState, currentEpoch uint64, localValidators []uint64,
) bool {
    if headState.Version() < clparams.FuluVersion {
        return true // pre-Fulu: process everything
    }
    // Fulu+: only if a local validator is proposer in current or next epoch
    // ...
When no local validator is a proposer, aggregateVerificationData stays nil and the aggregate is dropped:
    if localValidatorIsProposer || aggregateAndProof.ImmediateProcess {
        aggregateVerificationData, err = GetSignaturesOnAggregate(
            headState, aggregateAndProof.SignedAggregateAndProof, attestingIndices)
        // ...
    }
    // ...
    if aggregateVerificationData == nil {
        return ErrIgnore // → ValidationIgnore, message NOT forwarded
    }
This means most Erigon nodes on post-Fulu mainnet are dead-ends for aggregate attestations - they return ValidationIgnore for every aggregate, suppressing gossip forwarding.
Erigon also performs a block-seen check similar to Prysm's, but without a pending queue:
    if _, ok := a.forkchoiceStore.GetHeader(aggregateData.BeaconBlockRoot); !ok {
        return fmt.Errorf("%w: block not seen: %v", ErrIgnore, aggregateData.BeaconBlockRoot)
    }
Unlike Prysm, there is no savePendingAggregate() and no re-broadcast. A pending queue exists but the call is commented out:
    if aggregateData.Slot > a.syncedDataManager.HeadSlot() {
        //a.scheduleAggregateForLaterProcessing(aggregateAndProof)
        return fmt.Errorf("%w: aggregate is for a future slot", ErrIgnore)
    }
Why we still see ~19% tail from Erigon peers: the Erigon peers in our data may have returned ValidationAccept - i.e. nodes with active proposer duties that accept and forward aggregates. Since non-proposing Erigon nodes return ValidationIgnore (like behind Prysm nodes), they also don't add the message_id to their gossipsub seen cache. When Prysm re-broadcasts arrive, Erigon proposer-nodes that are meshed with behind peers may receive these re-broadcasts and forward them - producing the ~19% tail rate.
Takeaways
- ~28% of aggregate attestation observations are rebroadcasts, not late-arriving novel messages. 95.2% of tail observations share a
message_idwith a peak observation - Prysm's pending attestation queue may be the cause. When a Prysm node hasn't processed the referenced block, it queues the aggregate and returns
ValidationIgnore. When the block arrives, it re-publishes viaBroadcast(). Tail timing correlates with block arrival at r = 0.91 ValidationIgnoremay create a gossipsub seen-cache hole that allows the re-broadcast to cascade through other behind Prysm nodes. Peers that already accepted the original deduplicate and ignore it - which may explain why Teku (<1%) and Lighthouse (~1%) show almost no tail- Per-peer variance is high (Prysm IQR 10-54%), driven by how quickly each node processes blocks relative to aggregate arrival