
Snooper Overhead on newPayload

Question
What is the serialization overhead of rpc-snooper on engine_newPayload calls, and is the overhead consistent across EL clients?
Background
The rpc-snooper is deployed on the 7870 mainnet reference nodes. It sits between the consensus layer (CL) and execution layer (EL), intercepting Engine API calls to capture timing data.
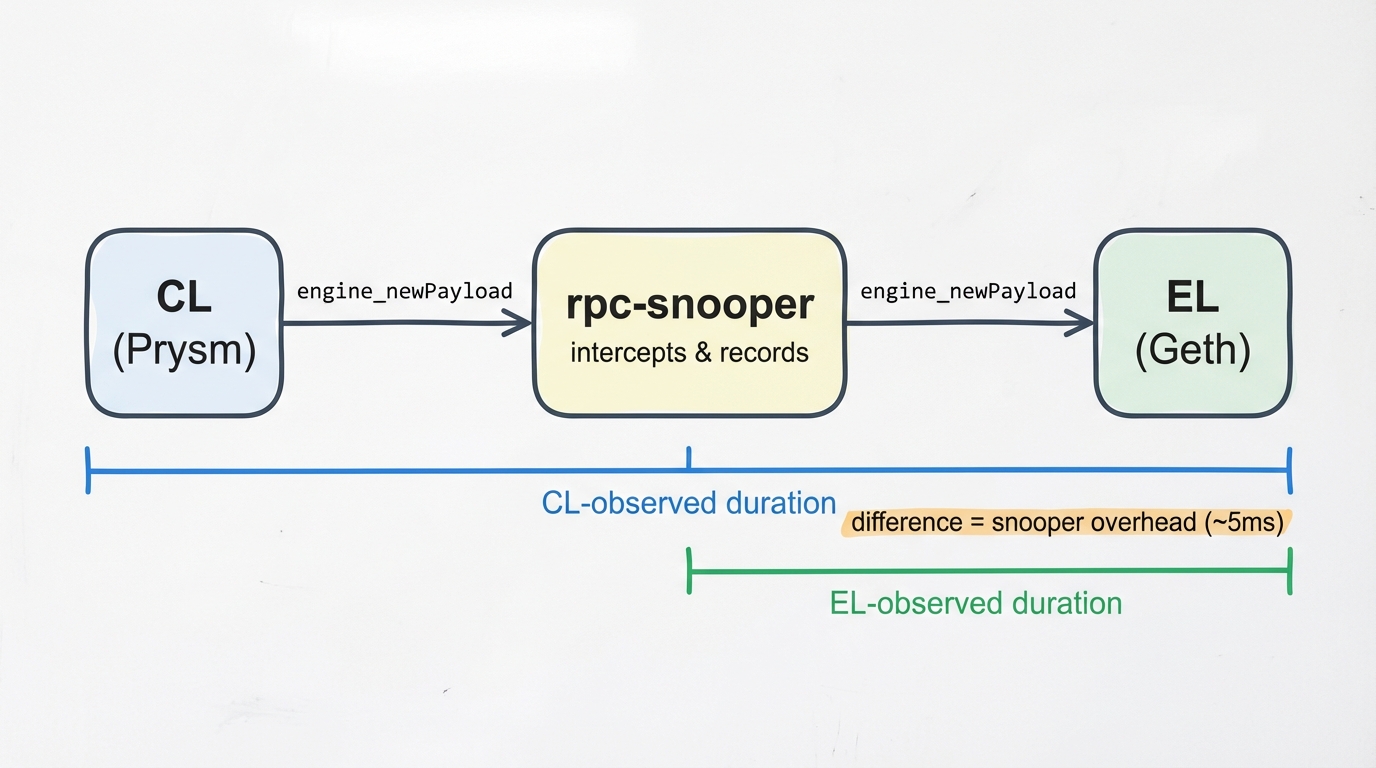
Here we're looking at engine_newPayload — where the CL sends a new execution payload to the EL for validation. We already measured get_blobs overhead separately. Since newPayload involves heavier EL-side processing (block execution), the snooper's relative overhead should be smaller here.
Methodology
Since the 7870 nodes report to both tables, we can measure overhead on a per-slot basis by joining the CL-side and EL-side observations of the same newPayload call on the same block:
consensus_engine_api_new_payload— Duration as observed by the CL (CL → snooper → EL → snooper → CL)execution_engine_new_payload— Duration as observed by the snooper (snooper → EL → snooper), filtered tosource = 'ENGINE_SOURCE_SNOOPER'
For each matched block, overhead = CL duration - EL duration.
Investigation
When Comparing Across Clients
Per-client summary of the snooper overhead across ~67,800 matched slots on January 26.
View Query: snooper_newpayload_end_to_end
P50 overhead is 4-5ms across all EL clients. Erigon's mean looks high (17.9ms) but that's 23 extreme outliers (up to 7.8s) out of 13,572 calls pulling it up. Its trimmed average is 5.1ms, same as everything else. The overhead is a fixed serialization cost — it doesn't depend on what the EL is doing.
Slower clients feel it less: Erigon at ~427ms avg only loses ~4% to the snooper, while Reth at ~54ms avg loses ~10%.
When Looking at the Distribution
How the serialization overhead is distributed across all newPayload calls.
View Query: snooper_newpayload_overhead_distribution
~81% of all calls fall in the 2-10ms range. The 4-6ms bucket is the most common at ~34%. Less than 1% of calls exceed 20ms.
Takeaways
- Median overhead is 4-5ms for
engine_newPayload, regardless of EL client - It's a fixed serialization cost that doesn't scale with payload size or EL processing time
- 81% of calls land in the 2-10ms range; less than 1% exceed 20ms
- Erigon has rare extreme outliers that inflate its mean, but its P50 is the same as everyone else
- Relative impact: ~4% on slow clients (Erigon) up to ~10% on fast clients (Reth)
- Together with the get_blobs results, the snooper is fine for production on reference nodes